Introduction
The Energy efficiency in buildings it is crucial, and the effectiveness of Thermal insulation In the facades, it plays a key role in this context. However, a significant challenge arises, especially when insulating from the interior: thermal bridges generated by the metal studs of the interior lining. These points of discontinuity often go unnoticed by architectural studies and can significantly compromise insulation performance.
The thermal bridges represent critical areas where the continuity of insulation is interrupted, which, when insulated from the inside, becomes a recurring challenge. Negligence in considering these points can result in significant heat loss, increasing the energy demand to maintain thermal comfort conditions. On the other hand, effectively addressing these thermal bridges not only Optimise the performance of the existing insulation, but also entails a reduction direct in the energy demand And in the isolation used, contributing to the environmental and economic sustainability of buildings.
Furthermore, it is important to highlight that thermal bridges can cause cold spots on interior surfaces, which, upon contact with hot air, can promote Condensations, leading to mould problems (with health implications) and compromising durability of building materials.
In this study, we focus on evaluating how meticulous attention to thermal bridges, particularly those associated with metal studs in interior partitions, not only improve insulation efficiency but also offer an opportunity to achieve higher thermal performance with a least amount of material. This is revealed as a key aspect in optimising efficient and sustainable designs when tackling the specific challenges posed by internal insulation.
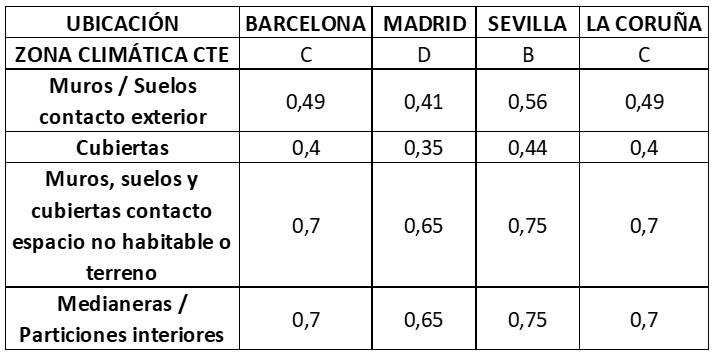
As a reference, thermal transmittances are used, where lower values indicate lower energy losses due to conduction. Therefore, generally, A facade with low thermal transmittance is a more efficient facade. However, to determine the optimal thermal transmittance and achieve precision tailored to the specific characteristics of each building and climate zone, it is recommended to carry out a dynamic energy simulation, as each case may present unique characteristics that require a more detailed cost-benefit analysis. For example, the DB HE 2019 (CTE) for new construction, establishes the following limit thermal transmittances for the climate zones in question:
Methodology and Results THERM
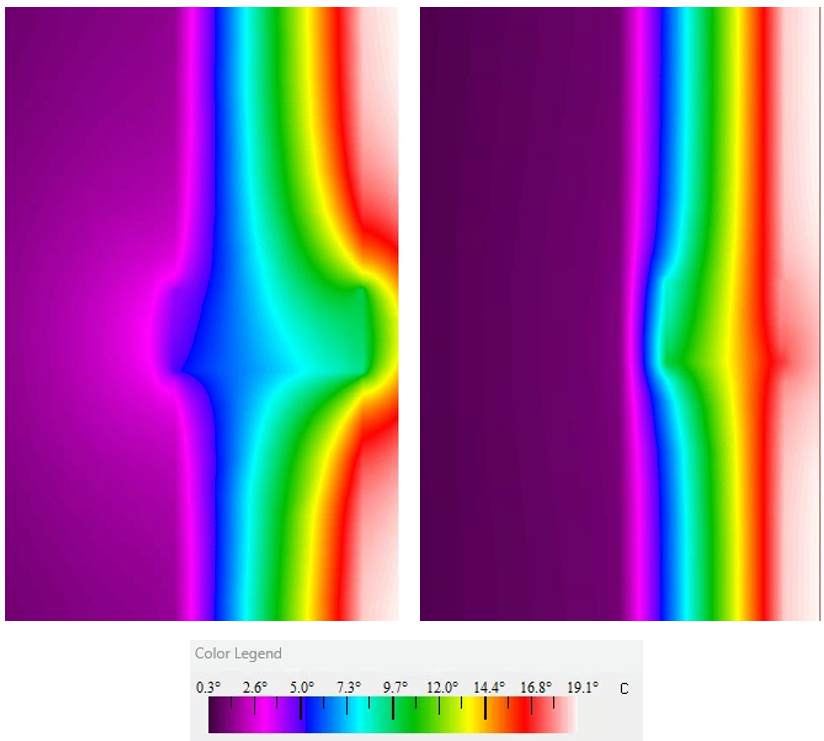
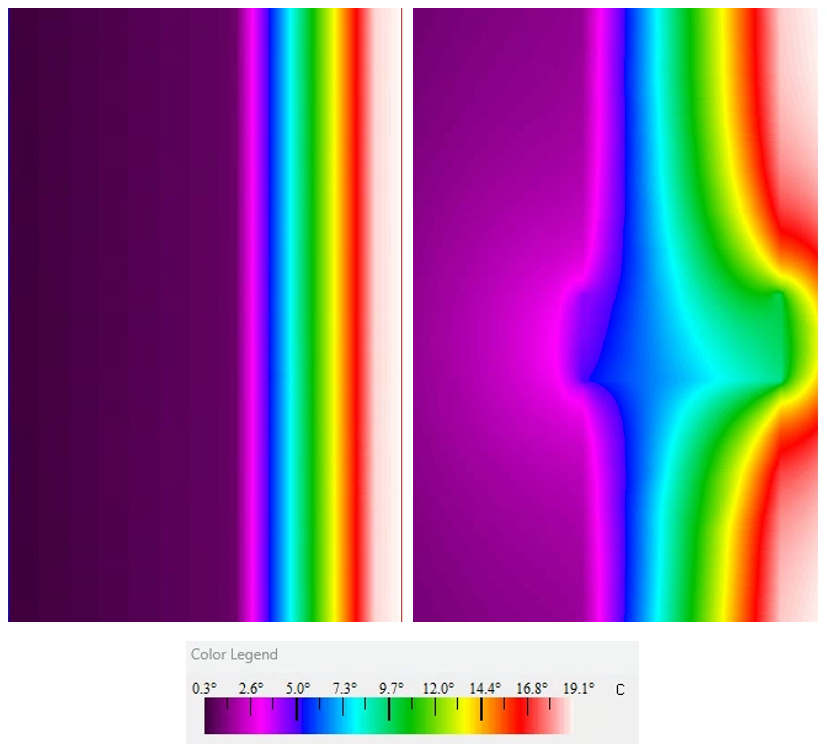
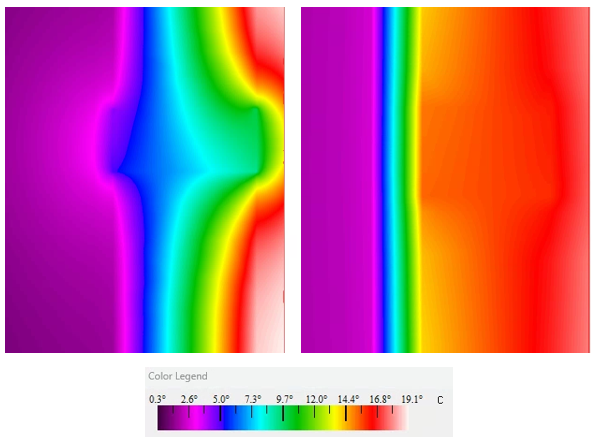
To evaluate the effectiveness of thermal insulation and understand the impact of thermal bridges, the tool was employed Therm In this study, the thermal transmittance of the enclosure was corrected, taking into account the influence of these thermal bridges in detail. In practical terms, specific boundary conditions were considered: an external temperature of 0°C and an internal temperature of 20°C.
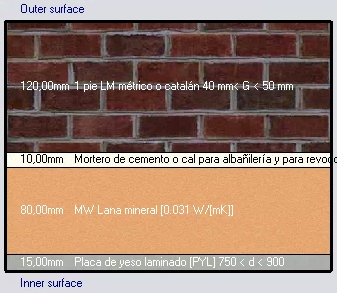
The lining of the analysed façade has the following characteristics:
- 8 cm thermal insulation
- Stud width 8 cm
- 3.5 cm strut wing
- Supports every 40 cm
This study focused on exploring four scenarios different ways to address thermal bridges:
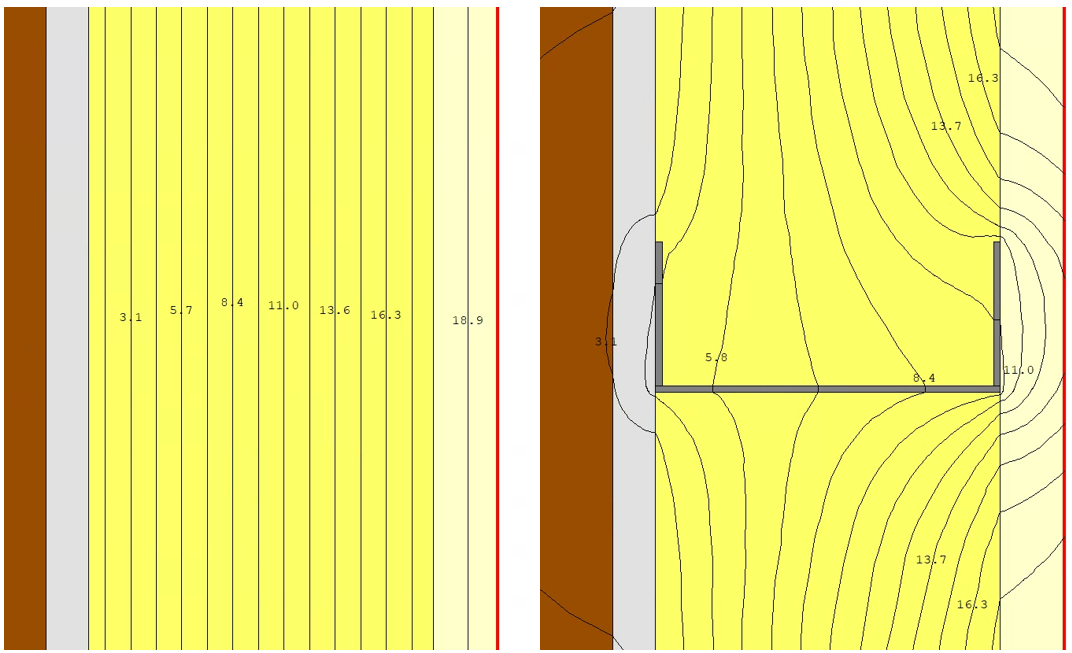
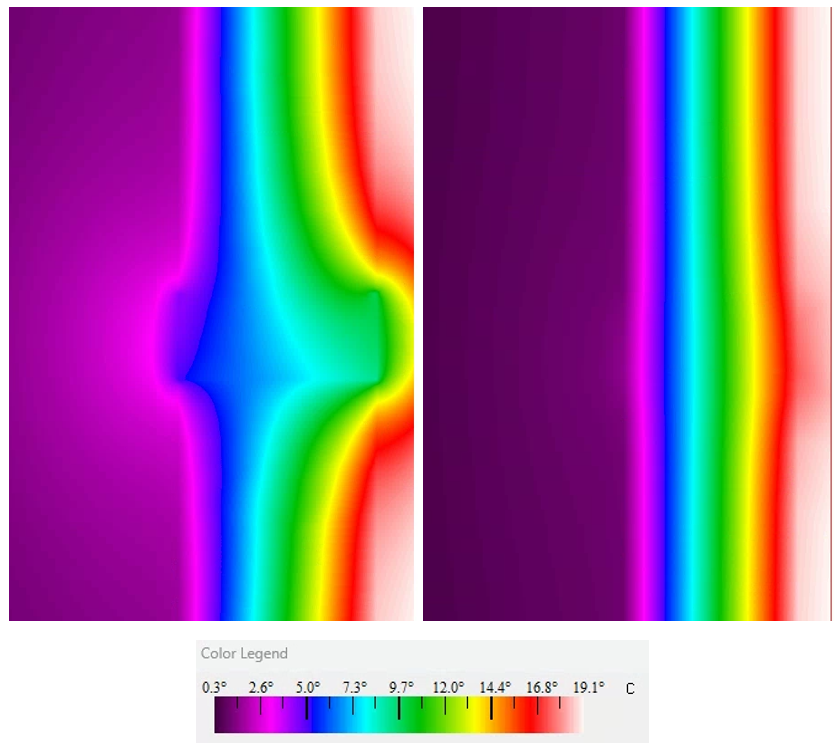
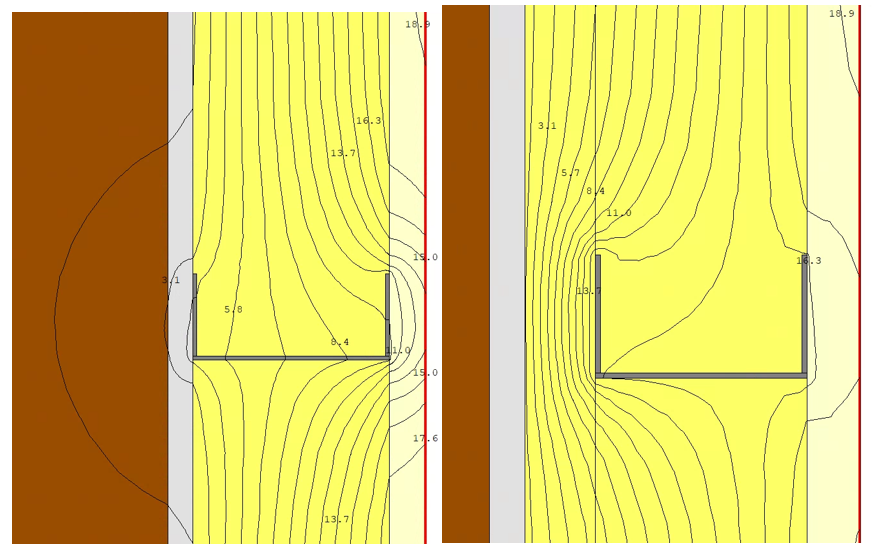
Scenario 1: Metal Studs
In this scenario, the conventional metal stud configuration was used, evaluating the effectiveness of thermal insulation under standard conditions.
Características del aislamiento:
- 8 cm of semi-rigid mineral wool: Conductivity 0.031 W/m-K
- Thermal transmittance without considering the metal mullions: U 0.344 W/m2-K
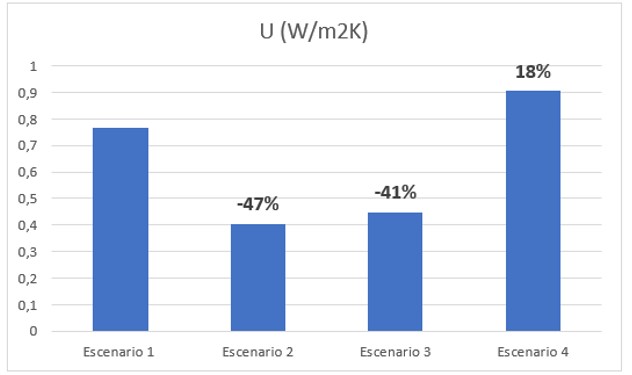
- Thermal transmittance considering metal studs: U 0.765 W/m2-K (increase of 122%)
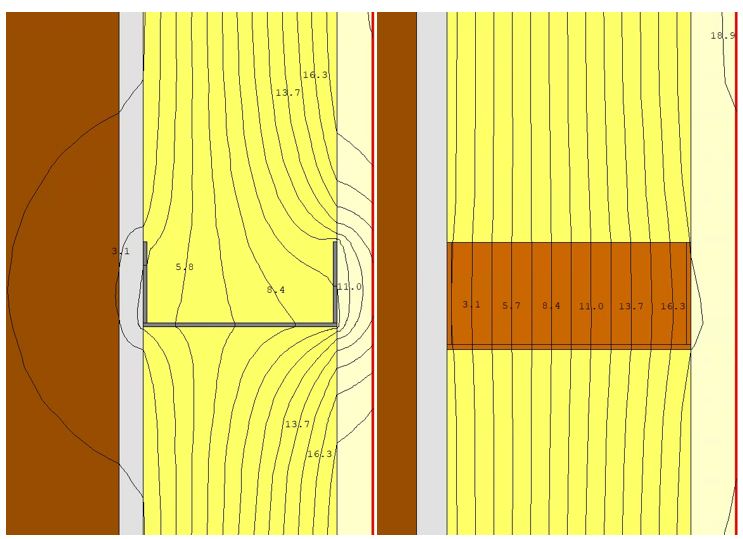
Scenario 2: Wooden Studs
In an effort to optimise performance, a significant modification was implemented: the steel stud was replaced with a wooden stud, which has lower conductivity. This improvement has led to a notable reduction in thermal bridging, thereby increasing the thermal efficiency of the facade analysed.
Características del aislamiento:
- 8 cm of semi-rigid mineral wool: Conductivity 0.031 W/m-K
- Thermal transmittance considering metal mullions: U 0.765 W/m²-K
- Thermal transmittance considering timber studs: U 0.405 W/m2-K (reduction of 47%)
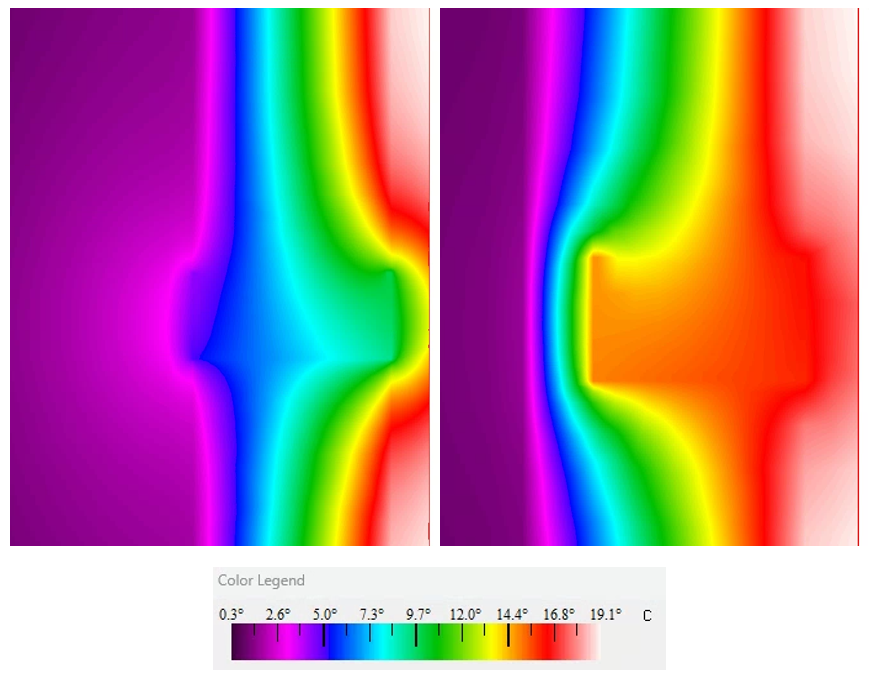
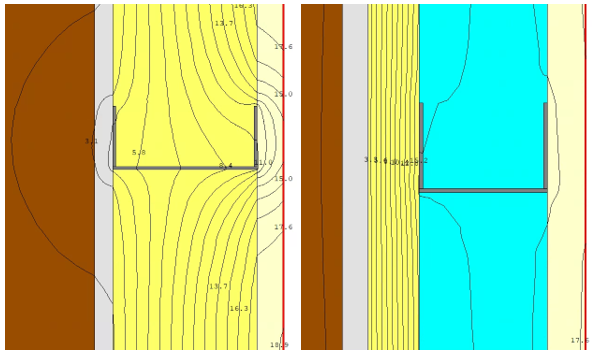
Scenario 3: Metal Studs with Continuous Insulation
The third scenario explored the option of setting the plasterboard backing a few centimetres away and placing a 2 cm semi-rigid mineral wool insulation behind it, designed to effectively break the thermal bridge created by the metal studs and reduce thermal transmittance. Furthermore, the insulation between studs has been reduced from 8 cm to 6 cm. This configuration aims to compare the impact of correcting the thermal bridge with scenario 1, which has 8 cm of insulation, but with the same total amount of insulation.
Características del aislamiento:
- 6 cm of semi-rigid mineral wool: Conductivity 0.031 W/m-K
- 2 cm of semi-rigid rock wool: Conductivity 0.031 W/m-K
- Thermal transmittance considering metal mullions: U 0.765 W/m²-K
- Thermal transmittance considering metal studs with continuous insulation: U 0.449 W/m2-K (41% reduction in thermal transmittance)
Scenario 4: Metal Studs without insulation and with continuous insulation behind
The fourth scenario involves removing the insulation between studs and maintaining only the continuous insulation behind the plasterboard.
Características del aislamiento:
- 2 cm of semi-rigid rock wool: Conductivity 0.031 W/m-K
- Thermal transmittance considering metal mullions: U 0.765 W/m²-K
- Thermal transmittance considering metal mullions with no continuous insulation behind: U 0.905 W/m2-K (an 181% increase in thermal transmittance whilst reducing the thickness of the insulation by 75%)
Summary of scenarios
Analysis of the impact of thermal bridges in different climatic zones
Following the assessment of the Scenarios raised, it is fundamental to understand how these configurations affect thermal efficiency in different climate zones from the Iberian Peninsula. The Climate varies significantly from north to south, and from coast to inland, implying unique challenges for the thermal design of buildings.
The analysis of the energy demand was carried out using the tool Design Builder, with the aim of understanding the influence of the thermal bridge as a function of the type of climate. This tool allowed for a precise and detailed exploration of how corrections in the Thermal transmittance The building envelope's performance affects energy needs in different climatic zones of the Iberian Peninsula.
In the context of this study, a basic design rectangular office building of 415 m2 was taken as a reference to examine energy savings and thermal efficiency of insulation.
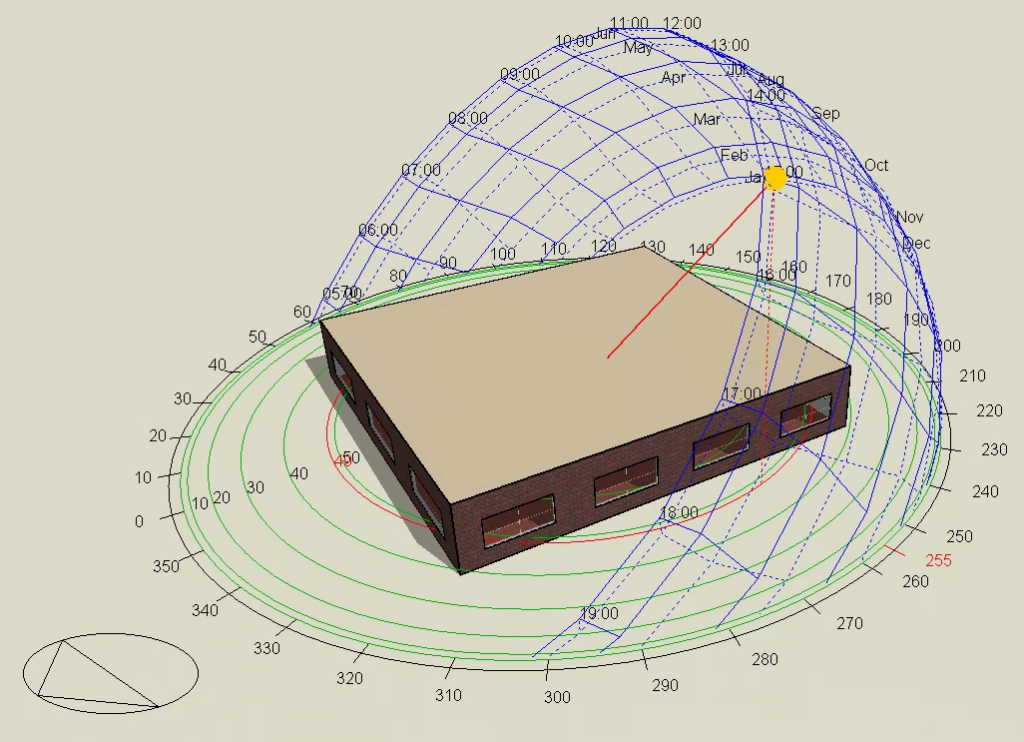
The aim is to provide a more comprehensive and regionalised perspective of how different Thermal design scenarios affect the energy needs in diverse climatic contexts. This analysis will allow us not only to understand the efficiency from each scenario in general terms, but also to adapt our recommendations to the particular conditions of each geographical location.
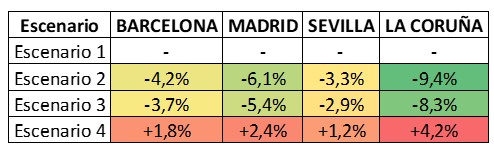
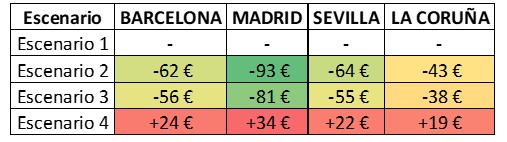
Hereafter, the results will be presented. energy demand with respect to Scenario 1, obtained by energy simulation:
Assuming an electricity cost of €0.2/kWh, a COP of 4 and an EER of 3, the following variation results are obtained Annual energy consumption With regard to Scenario 1:
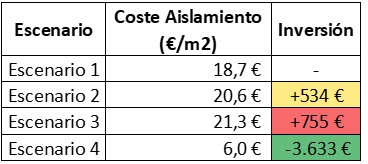
Furthermore, to carry out the cost-benefit analysis, a price per square metre has been estimated for each insulation solution, giving the investment Regarding scenario 1:
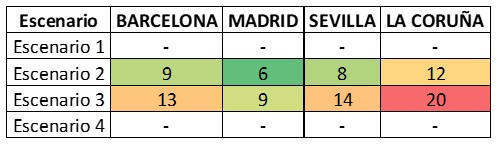
Finally, the following results have been obtained from repayment With regard to Scenario 1:
Conclusions
The detailed study using the THERM tool has provided valuable insights into thermal design strategies for facades when insulating from the interior. The key conclusions based on the obtained results are presented below:
Metal Studs vs. Wood Studs:
- Consider the metal uprights of the stud wall. Increase thermal transmittance in a 122%.
- Using wooden studs instead of metal ones significantly corrects the thermal bridge, with a reduction of 47% on the transmittance. However, using wooden studs is more Dear.
Continuous Rigid Insulation Behind the Stud Wall
- The option of using continuous rigid insulation behind the lining corrects the thermal bridge, achieving a reduction of 41% in thermal transmittance with the same insulation thickness.
Remove Insulation Between Studs
- The strategy of using only continuous rigid insulation behind the plasterboard and eliminating insulation between studs increases by just 18% thermal transmittance, showing the impact of using continuous insulation compared to using greater thickness of insulation and not addressing thermal bridges.
Metal studs reduce the thermal insulation efficiency by 122%
On the other hand, the Energy demand analysis carried out in different climatic zones with Design Builder highlights the following conclusions:
- The optimisation of thermal bridges and the reduction of thermal transmittance (scenarios 2 and 3) lead to a notable decrease of energy demand. This positive impact is mainly evident in climates with high heating demand, such as in Madrid and La Coruña, but also in more temperate climates, such as Barcelona and Seville.»
- Correct the thermal bridge caused by the metal stud by using one less layer of 75% insulation (scenario 4) increase slightly energy demand in all climatic zones, especially in those with mild climates and higher heating demands (La Coruña) but reduce significantly the investment.

Francesc Borrell Forner, Consultant in Sustainability and Energy Efficiency
Espacios Evalore SLP